Affiliations:
John K. Dagsvik, Statistics Norway, Research Department;
Mariachiara Fortuna, freelance statistician, Turin;
Sigmund Hov Moen, Westerdals Oslo School of Arts, Communication and Technology.
Corresponding author:
John K. Dagsvik, E-mail: john.dagsvik@ssb.no
Mariachiara Fortuna, E-mail: mariachiara.fortuna@vanlog.it (reference for code and analysis)
Raw data organization
The data used in this project were collected by Sigmund Hov Moen, and are available in the Rimfrost system, www.rimfrost.no.
All the data are available in the tempFgn repository, see the temperature data section for more.
They consist of a large amount of monthly and annual temperature time series from all around the world.
The raw data, as organized in the Rimfrost system, are collected in the folder “data/raw”
The “data/raw” folder contains 101 subfolders named with the English or the Norwegian name of the countries included in the Rimfrost system.
Each country folder contains the temperature time series for each weather station included in the Rimfrost system.
Data structure
Each time series is collected in a separate txt file, usually named with the Norwegian name of the weather station.
Each file is structured as follow:
Column 1: Year
Columns 2-13: Monthly temperatures in that year, from January to December
Column 14: Average annual temperature, measured as mean of the monthly temperarures for that year
There are no column names, and the missing data are usually recorded with the string 99 (but several exceptions are present).
As an example, these are the first six rows of the Paris.txt file.
|
V1
|
V2
|
V3
|
V4
|
V5
|
V6
|
V7
|
V8
|
V9
|
V10
|
V11
|
V12
|
V13
|
V14
|
|
1757
|
-0.33
|
3.73
|
6.03
|
11.23
|
14.53
|
19.03
|
24.63
|
19.63
|
16.23
|
8.23
|
9.03
|
0.43
|
11.0
|
|
1758
|
1.63
|
3.93
|
7.93
|
10.03
|
18.53
|
20.33
|
17.93
|
20.83
|
15.43
|
9.83
|
5.63
|
3.13
|
11.3
|
|
1759
|
4.53
|
6.03
|
7.33
|
11.73
|
15.33
|
19.43
|
23.93
|
20.43
|
17.73
|
12.63
|
3.73
|
3.13
|
12.2
|
|
1760
|
0.23
|
3.63
|
6.63
|
12.33
|
16.03
|
20.03
|
21.63
|
19.73
|
18.73
|
11.83
|
7.53
|
1.43
|
11.6
|
|
1761
|
1.83
|
6.33
|
8.73
|
10.83
|
16.33
|
19.53
|
21.43
|
21.93
|
18.33
|
10.43
|
5.63
|
6.43
|
12.3
|
|
1762
|
4.93
|
4.03
|
4.03
|
13.83
|
17.33
|
19.93
|
23.33
|
19.63
|
16.83
|
9.83
|
5.83
|
2.63
|
11.8
|
Main features of the raw data
In order to select the set of suitable time series and explore their main features, we first provide a preliminary table with useful information (T0_Information). This table contains general information about all the available time series, namely:
Country and Station name for each time series
Its Status. The Status variable provides the results of some validation checks about the data format. “OK” means that the time series passed the checks, “ERROR” means that it did not pass the checks (eg the file has a wrong number of columns)
From and To show the first and the last year of the recorded time series
Length shows the length in years of the time series
Missing shows the number of missing annual average temperature. NA means Not Available
As an example, consider the first 20 rows of the T0_Information table:
|
Country
|
Station
|
Status
|
From
|
To
|
Length
|
Missing
|
|
afganistan
|
herat
|
OK
|
1963
|
1990
|
28
|
16
|
|
afganistan
|
kabul
|
OK
|
1961
|
1992
|
32
|
12
|
|
afganistan
|
mazar_i_sharif
|
OK
|
1964
|
1992
|
29
|
11
|
|
algerie
|
adrar
|
OK
|
1965
|
2011
|
47
|
4
|
|
algerie
|
alger_dar_elbeida
|
OK
|
1923
|
2011
|
89
|
3
|
|
algerie
|
beni_abbes
|
OK
|
1931
|
2011
|
81
|
25
|
|
algerie
|
constantine
|
ERROR
|
NA
|
NA
|
NA
|
NA
|
|
algerie
|
el_golea
|
OK
|
1930
|
2011
|
82
|
3
|
|
algerie
|
in_amenas
|
OK
|
1963
|
2011
|
49
|
8
|
|
algerie
|
in_salah
|
OK
|
1964
|
2011
|
48
|
4
|
|
algerie
|
oran
|
OK
|
1908
|
2011
|
104
|
12
|
|
algerie
|
tamanrasset
|
OK
|
1940
|
2011
|
72
|
2
|
|
alpene
|
andermatt
|
OK
|
1966
|
2006
|
41
|
2
|
|
alpene
|
basel
|
ERROR
|
NA
|
NA
|
NA
|
NA
|
|
alpene
|
davos
|
OK
|
1901
|
2006
|
106
|
2
|
|
alpene
|
engelberg
|
OK
|
1931
|
2006
|
76
|
2
|
|
alpene
|
geneve_ecad
|
OK
|
1901
|
2009
|
109
|
1
|
|
alpene
|
geneve
|
ERROR
|
NA
|
NA
|
NA
|
NA
|
|
alpene
|
graz
|
OK
|
1894
|
2009
|
116
|
1
|
|
alpene
|
hohenpeissenberg
|
OK
|
1781
|
2009
|
229
|
2
|
Raw data basic exploration
The total number of availbale time series is 1260.
The table below provides a summary of the information given about each recorded variable:
|
|
Status
|
From
|
To
|
Length
|
Missing
|
|
|
ERROR: 225
|
Min. :1701
|
Min. :1869
|
Min. : 5.00
|
Min. : 0.00
|
|
|
OK :1035
|
1st Qu.:1890
|
1st Qu.:2009
|
1st Qu.: 61.00
|
1st Qu.: 1.00
|
|
|
NA
|
Median :1925
|
Median :2011
|
Median : 84.00
|
Median : 2.00
|
|
|
NA
|
Mean :1917
|
Mean :2008
|
Mean : 92.28
|
Mean : 5.57
|
|
|
NA
|
3rd Qu.:1949
|
3rd Qu.:2012
|
3rd Qu.:122.00
|
3rd Qu.: 6.00
|
|
|
NA
|
Max. :2002
|
Max. :2012
|
Max. :312.00
|
Max. :104.00
|
|
|
NA
|
NA’s :225
|
NA’s :228
|
NA’s :225
|
NA’s :225
|
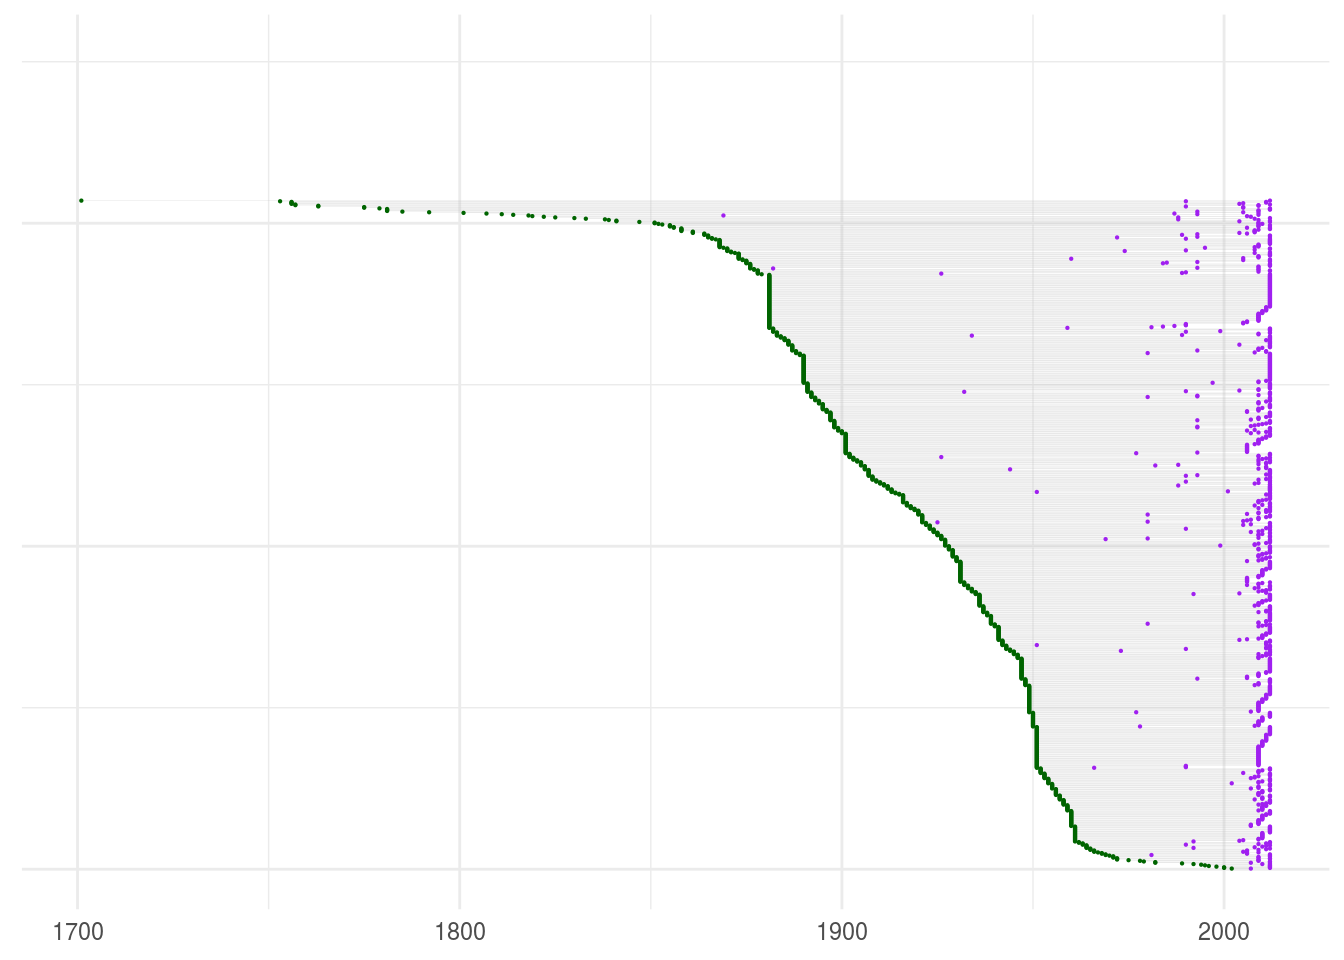
The following graph shows all the available time series, sorted by first recorded year. The green dot represents the first recorded year, while the purple dot represents the last recorded year. The grey segment represents the length of the time series.
SELECTION PROCESS
Given the wide variety of properties of the available time series, we decided to apply a multi-step automatic selection procedure to obtain a subset of series with specific characteristics.
In any case, the full set of available time series (1260) is contained in the data/raw folder, and can be analyzed with the provided code.
Multi-step automatic process
Briefly, the multi-step process was designed as follow:
Step 1 - Valid structure: selection of the time series with valid data structure
Step 2 - Length in years: selection of the time series with more than 105 recorded years
Step 3 - Recorded months: selection of the time series with more than 1280 recorded months (non missing)
Step 4 - Missing months: selection of the time series with less than 80 missing months
Step 5 - Length in months: selection of the time series with full monthly length not inferior to 1290 months
Step 1 - Selection by valid structure
Using the information table previusly built (T0_Information), we selected all the time series with the variable Status equal to OK.
Here the results of the selection procedure for valid structure (step 1):
##  Cleaning data - Step : 1
##  ************************************
##  1035 accepted time series over 1260
##  Current step acceptance rate : 82.14 %
##  Loss from step 1: 17.86 %
Step 2 - Selection by length (years)
The second step of our selection procedure was to identify all the time series that had more than 106 recorded years.
The results of the second step of the selection procedure follows here:
##  Cleaning data - Step : 2
##  ************************************
##  376 accepted time series over 1035
##  Current step acceptance rate : 36.33 %
##  Loss from step 1: 70.16 %
At this point, our subset consists of 376 weather stations.
Step 3 - Selection by available months
We can now refine the selection procedure checking that the number of non missing months is superior to 1260.
Here the results of this selection step:
##  Cleaning data - Step : 3
##  ************************************
##  329 accepted time series over 376
##  Current step acceptance rate : 87.5 %
##  Loss from step 1: 73.89 %
Step 4 - Selection by missing months
We can now exclude all the time series with number of missing months above 80.
Recall that the previous step was about non missing months: in this step we are avoiding time series that (although long), contain so many “holes” that they might compromise the data quality.
Here the results of this selection step:
##  Cleaning data - Step : 3
##  ************************************
##  278 accepted time series over 329
##  Current step acceptance rate : 84.5 %
##  Loss from step 1: 77.94 %
Step 5 - Length in months
The last step of the selection procedure is to check if the total length of the time series (from the first recorded month to the last one, missing included) is not inferior to 1290.
Above the results:
##  Cleaning data - Step : 5
##  ************************************
##  277 accepted time series over 278
##  Current step acceptance rate : 99.64 %
##  Loss from step 1: 78.02 %
At this point we have a subset of 277 waether stations, characterized by a valid data structure and a length and presence of missing observation below specific thresholds.
Final selection
In order to select the final set of weather stations we proceded by manual inspection of all the time series.
We excluded all the time series with substantial quality problems, such as those with extreme outliers and several consecutive missing over time intervals.
In the final selection we tried as much as possible to select weather stations that were distributed across most parts of the world.
Final data
Summary statistics of the selected of 96 time series is shown in Appendix B, table B1.
There are two time series that did not pass the tests but we still included them in our analysis. One is from Ivittuut, Greenland, and the second one is from Uppsala, Sweden. The reason is that Greenland is of particular interest in the climate debate, and the temperature series from Uppsala is the longest time series ever recorded.
All the selected time series are available in the data/final folder. All the names (country and stations) have been translated to English.
We have highlighted results from 9 weather stations because they are well known cities with good quality of the temperature data.